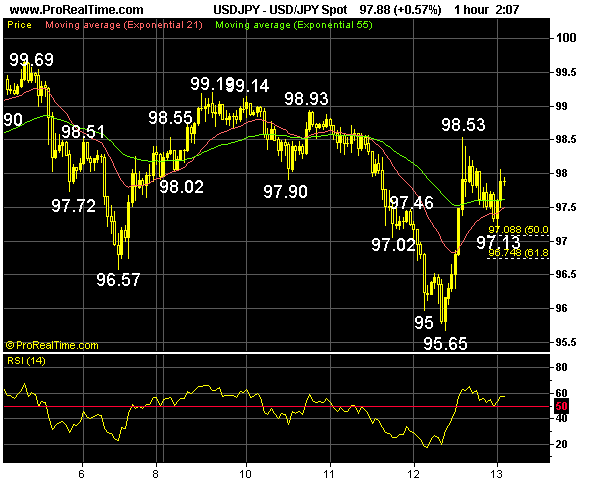
        USD/JPY - 97.65...Despite y'day's initial selloff to 95.65 (several stops
were triggered), the dlr staged a strg rebound fm there as an option barrier at
95.50 was successfully defended n intra-day rise accelerated in U.S. session on
the back of the strength in U.S. equities n also active cross selling in yen
(eur/jpy rallied fm 122.16 to 126.40), price hit a session high of 98.53 in NY
b4 retreating.
      Y'day's cross-inspired rally signals the decline fm 99.69 (March 5 high)
has formed a temporary low at 95.65 n consolidation abv there is seen with mild
upside bias, abv 98.53 wud extend gain twds pivotal res at 99.19 but only a
breach of this lvl wud signal recent upmove fm January's multi-year low at 87.10
has finally resumed, bring re-test of 99.69 n then twds the 'psychological'
100.00 level.
      Below 97.02/09 (sup n 50% r of 95.65-98.53) wud yield weakness twd 96.52
(prev. res) but reckon aforesaid low at 95.65 wud hold on 1st testing, bring
further choppy trading...
|

.JPG)

Няма коментари:
Публикуване на коментар
Please comment this article , your oppinion is important for us. And please use propriate language - be correct .